Using insights and tools to inform campaign management in Q4
Media and search marketing campaigns are a crucial part of achieving success in Q4 – the ‘golden quarter’ of the year. If you’re behind the curve, or finding that your always-on campaigns need some refocusing, there’s no need to worry yet! Pull yourself out of the recurring trap of upping budgets and doing more of the same, and take the time to explore how insight and tools can make your campaigns focused, targeted and, most importantly, highly effective.
Before you start actioning your plans for the 4th quarter of the year, there are 3 key questions you should be asking yourself. We’ll dive into each one in detail.
- Where is the opportunity? (Demand)
- Where do we need to be to reach that audience? (Channel use)
- What do we say to them when we get there? (Sentiment/discourse)
Understanding demand
To focus your campaigns, it’s important to identify where demand lies. A good starting point is to use search data, and the best source of that is Google Keyword Planner.
Whilst there are other 3rd party tools that try to predict volume based on their own databases and various data collection methods, in my opinion going to ‘the source’ is still the most reliable. Google Keyword Planner is preferable over Google Trends to get absolute volumes for comparison, because Trends provides a normalised 0-100 score based on relative percentages of total searches at a given time and location
This tool will help you find new keywords or get volume on those already in mind. By using this raw data, you can start to paint a picture of demand by categorising keywords and mining historic data (around 4 years’ worth of data is available within Google Keyword Planner).
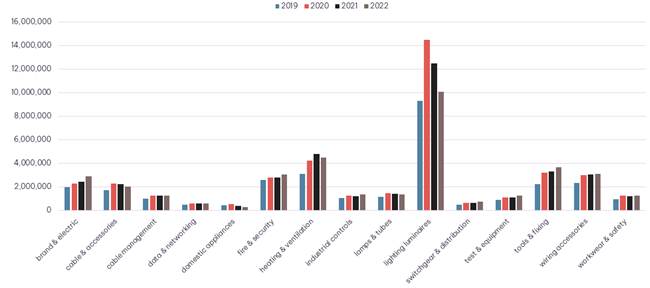
The above graph details where search demand lies and what it looks like year-on-year for a multi-category retailer. From this we can see that the ‘lighting’ category is by far the most searched. However the graph also shows this category having the biggest change in behaviour during the pandemic, and now declining back to almost pre-pandemic levels. By contrast, other categories such as ‘EV’, ‘fire & security’ and ‘tools and fixing’ are actually steadily increasing in demand.
It’s important to note that the tool will only provide you with past volumes (they usually update mid-month for the month gone). For bonus points, you could even look to model this data by using a machine learning environment such as RStudio to predict what future months volume could look like.
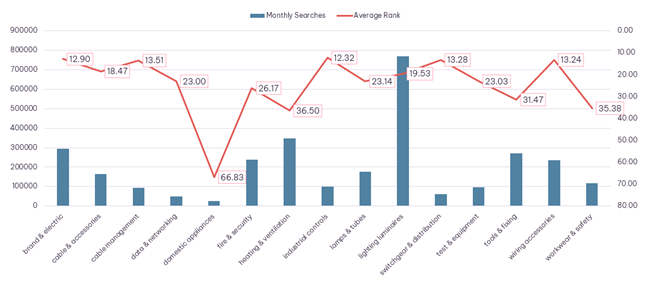
To understand headroom, you can overlay other metrics such as average rank (which can be a noise signal but is easy to calculate), SOV (harder to calculate but factors in that not all keywords are equal) and/or PPC impression share.
Other sources of search market data can be found in Google Search Console by downloading keyword impressions, but these are sampled from the top 1,000 phrases you rank for organically or in Google Ads. There’s also the Auction Insights report, but again this relies on you having consistently been in keyword auctions, and doesn’t include data for keywords you don’t bid on.
Now that you’ve understood where demand is and decided on the categories you want to push, you need to understand how to reach those audiences.
Channel use
Speaking broadly, content discovery/consumption is more disparate than ever. Users and advertisers are spoilt for choice - should we have a TikTok strategy? What about Threads? I use Google Discover to search, so we should be there? Too many options can leave marketers getting lost and chasing red herrings in search of incremental reach in peak.
This is why it’s important to make objective, research-based decisions when channel planning. The key question is where does my audience reside? You can do this relatively quickly by using YouGov to find out your audiences’ views on channel use.
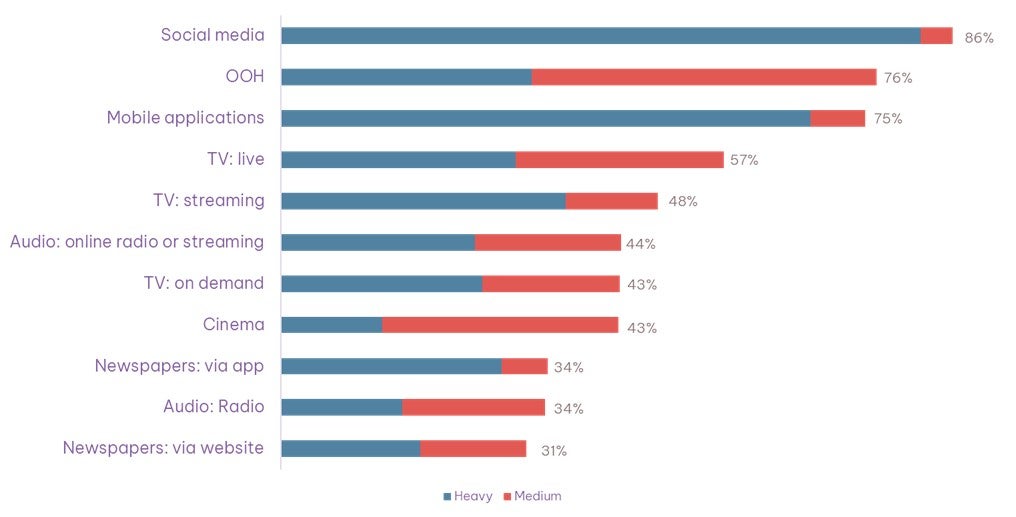
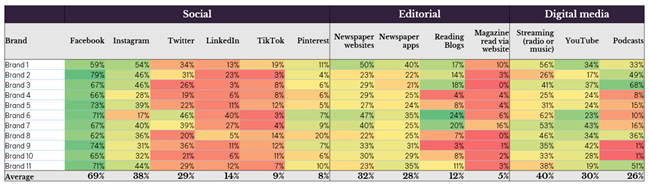
YouGov collects first party data from millions of panels and is a great resource for a full spectrum of audience insights. Mining your audience’s attitudes towards channel use allows you to build a picture of the types of media to consider – both traditional and digital. You can then break this down further and look for trends at a more granular platform level, which allows you to make strategic decisions about where to invest time and budget.
Of course, there are other ways to get valuable channel information.
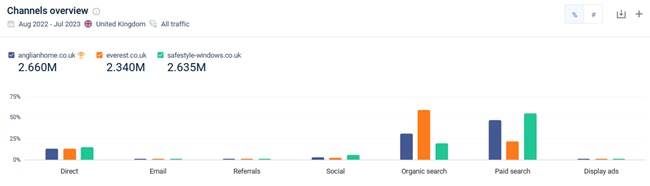
SimilarWeb uses click stream data from a variety of sources in their channel overview report. This shows you which channels your competitors are using. You can also delve deeper into reports for individual channels to find the specific types of activity behind the visits.
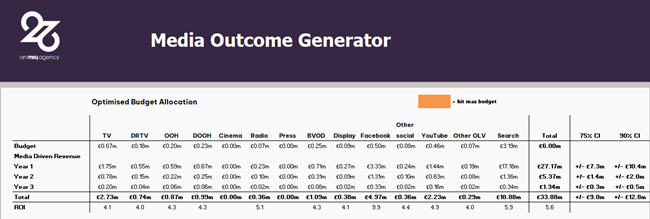
If you have a more mature marketing function, you may have invested in Econometrics or Media Mix Modelling (MMM) and already have a clearer idea of where to invest and the potential returns. If you don’t have that luxury, at 26 we have a propriety planner tool that is based on normalised econometric models of hundreds of established brands.
We can model with ~65-70% accuracy where your media investment should be placed, and what the potential returns look like across a breadth of digital and traditional channels.
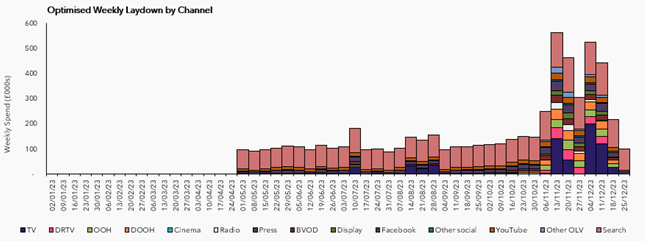
Taking that one step further, and factoring in seasonality, market trends and media cost, 26 can provide you with an illustration of when and where are best to lay down your media to maximise its return.
This is a useful starting point that can be validated and bolstered by using your own 1st party data from your analytics platform. We acknowledge that each business is different, and can have unique customer journeys. So when you’re planning your Q4 media spend, it’s important to understand where and how a customer buys, as well as the channels that assist the conversion. Could you dial particular channels up or down, or could introducing new channels help you hit your overall objective? For example, you might consider working with affiliates to promote offers in peak or running some display prospecting activity to boost brand SOV and CTR in search campaigns.
User sentiment & motivation
Once you’ve mined quantitative data sources to identify your hero categories and products, and worked out where your target audience is, just one final question remains… What do you actually say to them when you get there?!
You probably have an idea based on past marketing comms, or a certain hypothesis you want to test. But in such a crowded, competitive space, only the most compelling creative, content or search listings will achieve cut through and see results.
Investing in qualitative research can help explain ‘the why’ around customer behaviour. This can then direct you towards a better creative brief or strategic outcome such as the title or proposition for your campaign.
Qualitative customer research doesn’t have to cost a fortune and can be done quicker than you might think. My go-to tools for immediate customer insights are Canvas8 and Think With Google. You can also explore Global Web Index and YouGov which have lots of existing data but also allow you to craft your own panel questions for more bespoke insights.
If you want to go further, you can look to collect primary research from existing or potential customers in these ways:
- Social listening. Using a tool like Brandwatch or Pulsar can help you pick up on the latest conversations about your brand or product. You can then weave in the latest lexicon or address current customer needs in your campaigns.
- Interviews and focus groups. Conducting small customer focus groups or interviews encourages people to open up and in turn allows you to garner powerful insights on what people really think about you.
- Customer service logs. What are the burning questions people are asking about your products and/or services? How can your marketing address these needs?
- Onsite site surveys. Ask your user base directly about their experience by deploying polls at relevant points in their journey. Find these points within your quantitative research e.g. pages with high exits.
- Diary studies. This UX research method involves participants keeping a log of their thoughts, experiences, and activities over a defined period, usually a few days or more. These studies help to understand long-term behaviours such as habits, motivations, or changes in behaviour and perceptions.
- Effectiveness testing using biometrics. At 26, our biometric lab can be used to measure customers' physical and emotional responses to designs. This allows you to efficiently see if your creative and experiences are memorable and persuasive.
In summary
So, by now you know where to play (demand), how to reach your users (channels) and understand want you want to say when you reach them (sentiment).
From here you can plan anything! From launching tactical campaigns around Black Friday & Cyber Monday to refining always-on omni-channel campaigns that span the whole Q4. The larger you plan to go, the more time you should expect to invest in insights and planning to ensure effectiveness. As a rule of thumb, I believe you should spend anywhere between 5-15% of your time/budget on ensuring you’re crafting the right campaign(s) that resonate with your audience. With Q4 being the busiest quarter of the year, plus low confidence from customers, the need for effective planning is greater than ever. As the saying goes, if you fail to prepare, you’ve prepared to fail…
If you’re interested in how 26 can help you better research and plan your campaigns, get in touch for a friendly chat with our team.

Our insights
Explore the latest perspectives from our team.